It takes ongoing innovation and adaptation to stay ahead of the competition in the fast-paced world of digital marketing. In the toolbox of every SEO expert, the Infographic continues to be a favorite in 2025. Infographics are appealing tools in SEO that simplify complex data and make it easier for audiences to understand and interact with. In addition to increasing user engagement, they also make content more shareable, which increases organic traffic and boosts overall SEO performance.
In this article we will discuss powerful impact of SEO infographics, including different types of infographics along with useful advice on how to use them to boost your marketing plan. Let’s explore the reasons infographics are more important than ever!
What Is Infographics?
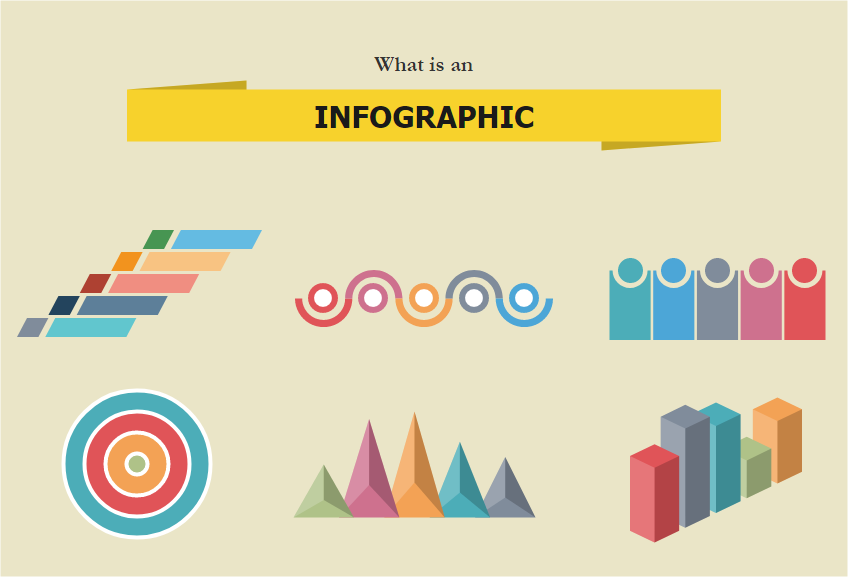
An infographic is a graphic depiction of data that provides a brief, understandable synopsis of a subject. They are useful for conveying ideas quickly, making complex data easier to understand, identifying patterns and linkages in data, and tracking variable changes. Since infographics can easily convey a lot of information, they are becoming more and more popular.
Top infographics include:
- Bar charts
- Pie chart visualizations
- Histograms
- Line graphs
- Diagrams of trees and networks
- Mental diagrams
- Gantt diagrams
- Tutorials
- Comparison
- Listings
The earlier examples shows how infographics combines text, graphics, charts, graphs as well as other visually appealing components. An infographic’s goals involve making difficult information understandable to non-technical people, presenting facts in an aesthetically pleasing way, telling a story, or successfully communicating a message.
What Is SEO Infographics ?
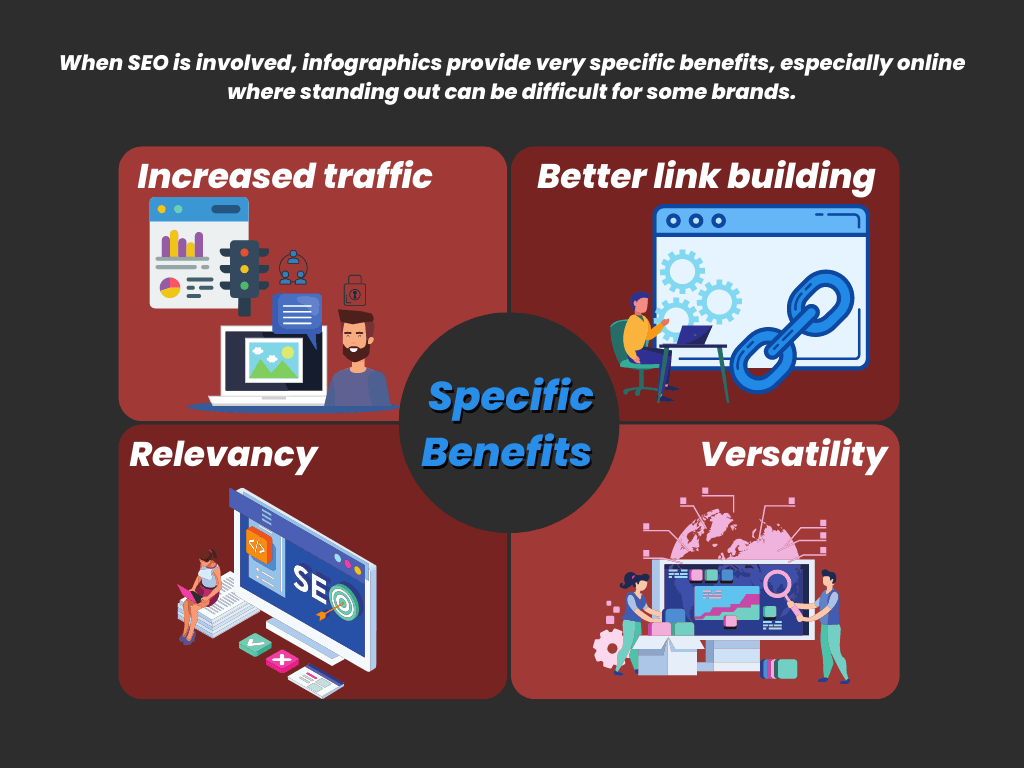
An infographic about SEO is a graphic that illustrates principles, methods, and tactics related to search engine optimization. It presents important SEO information in a clear, easy-to-understand format using text, charts, and graphics. Infographics are a useful tool for rapidly understanding complicated subjects like search engine optimization in this modern age of technology, where information overload is prevalent. They are a great way to break down difficult ideas and enhance your understanding of SEO tactics, regardless of your level of experience.
If you’re looking to understand SEO, explore our article Understanding the Basics and Different Types of SEO for a clear and detailed guide.
What Is The Primary Purpose Of SEO Infographics?
Simplifying difficult or boring content into visually appealing content that attracts to the audience is the main objective of SEO infographics. Along with that, the goal is to make the information easier to understand and more approachable through using examples, comparisons, and visual components. Moreover, it helps in increasing user engagement, improving shareability, and increasing organic traffic. These infographics can be effective tools to boost and assist search engine optimization efforts when they are carefully created. for example
As you can see the infographic image above shows the main components of MUU Serum, mentioning its healthful and natural qualities. The visual representation of every ingredient, such as chamomilla recutita and camellia sinensis leaf extract, offers an understanding of the product’s composition.
What are the Types of Infographics?
Following are the types of SEO Infographics:
1. List Infographics:
List infographics work great for providing evidence for a thesis or reasoning or for outlining important points. They can act as visual aids for a blog post, assisting readers in understanding what to expect to learn from reading it. As a result, they can also provide extra details to enhance your content.
2. Comparison Infographics:
Comparison infographics are a handy kind of infographic for viewers who wish to contrast the variations in order to figure out which option is the most practical or beneficial. This kind of presentation, for a blog author, may help the audience to:
- Learn about what to do and what to avoid regarding a subject.
- Analyze comparison with opponents.
- While it’s also popular to use HTML Tables, create an infographic to give a brief overview of the many plans that your organization offers.
- Professionally demonstrate timeframes.
- Draw attention to the key distinction between the two entities.
3. Statistical Infographics:
When stating facts and information to support the material on one’s blog or business website, statistical infographics are essential. Statistical infographics can incorporate data from several sources into fascinating content if you need to acknowledge it. An infographic, for example, could be used by an agency for marketing for displaying results for clients in a before-and-after style.
4. Timeline Infographics:
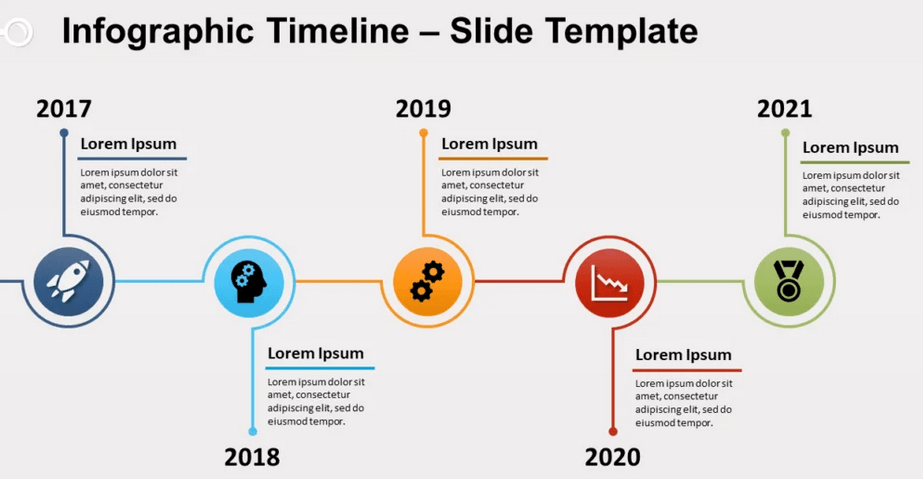
Infographics with timelines serve as great resources for those who visit websites. In a nutshell it is often utilized to outline the history of a subject or present a useful chronology of the occasions leading up to a forthcoming event. By presenting the background of a company or a significant person, this kind of infographic can help blogs and businesses increase the E-E-A-T (Experience, expertise, Authoritativeness, and Trustworthiness) of their websites. This might give visitors to a website an impression of trust.
5. Scientific:
They incorporate icons, group ideas into blocks, and use numbers to highlight particular data. They have sources as well.
6. Biographical:
They provide details about a person’s background, education, place of birth, and other information. They include pictures of the person involved and timelines.
7. Hierarchical:
These work well when exposing a process that needs to be completed in its entirety. They function in organizational charts as well.
8. Geographic:
These infographics use maps, various colors, and arrows and other icons to point to specific locations.
Top 4 Benefits of Infographics: Where They Are Applied For ?
With infographics’ increasing significance, now is the ideal moment to discover their top four advantages and what makes them such an invaluable tool!
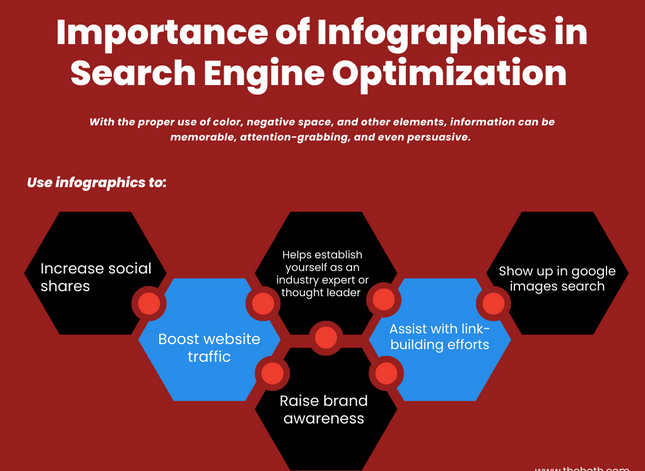
1. Increase Traffic to Your Website:
Infographics that are interesting and in line with keywords appear more prevalent in search outcomes and attract more visitors. Similarly, social media connections increase traffic by expanding their reach. Optimizing picture descriptions and alt text improves search engine visibility for relevant visitors.
2. Eye-Grabbing Links:
If other website owners think your infographic is useful, they may post it on social media or link to it. Your link equity is increased by high-quality links from reliable websites. Your website’s ranking for particular keywords may increase as search engines begin to value it more.
3. Boost Sharing Capabilities:
Using visually appealing infographics that are simple to share on social media can help you increase brand visibility. Clickable links in infographics make it easy to share them even months after they are first published, which may result in viral content, increased traffic, and brand awareness. Moreover, increased internet traffic tells search engines that your site is valuable, which raises your rating.
4. Enhance the User Experience Generally:
Consumers want to scan through long paragraphs quickly to get the information they need. Infographics present important information in a clear and concise manner, enhancing user experience by making important elements easily accessible. Search engines are significantly impacted by increased engagement with your high-quality infographics, which highlights the relevancy and worth of the information.
Importance of SEO Infographics In Digital Marketing:
To begin with, infographics are useful for obtaining natural backlinks. Individuals will be happy to post your gorgeous, eye-catching infographic on their own websites if it is packed with insightful statistics and data. By including an embed code on your web page, you can allow users to easily share your infographic with correct attribution and backlinks to its original source on their own blog posts or landing pages. Moreover, it also improve the probability of ranking tops for picture searches, which are a different kind of search and a feature of search engine results pages. To find out if your desired keyword has an image block, look through the SERP. If so, an infographic can assist you in increasing traffic and hits.
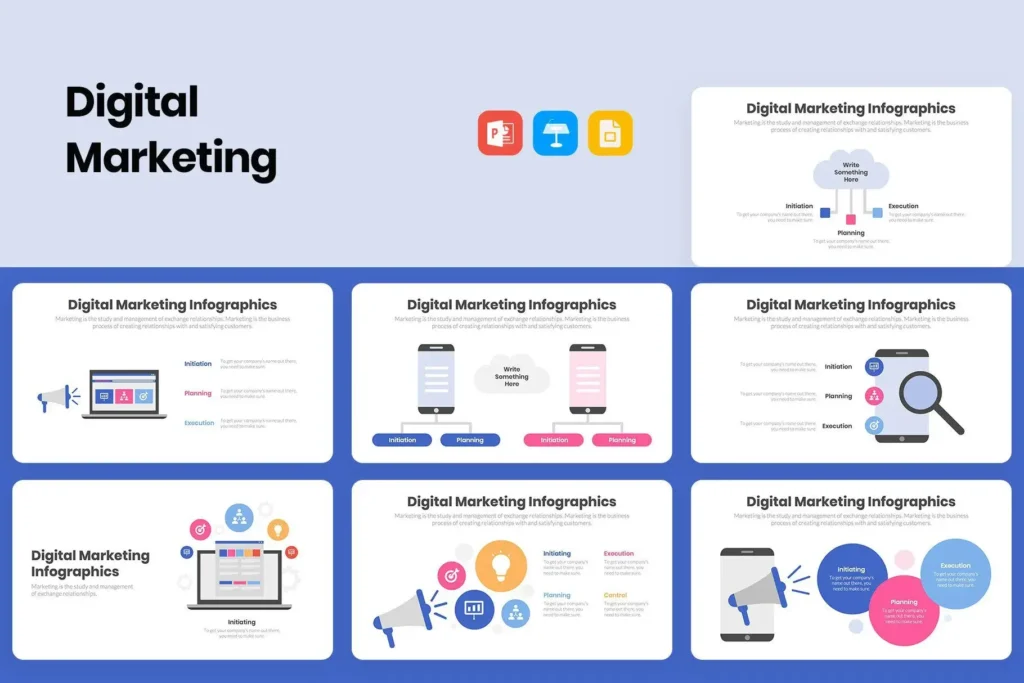
Moreover, infographics can aid in brand awareness-building. Infographics can convey critical information about your brand, products, or services through visually appealing content. In the end, infographics are a well-liked visual format that can assist you in raising the article’s general value and popularity.
FAQs
With the use of SEO infographics, you can effectively communicate your message by appealing to the visual portion of the brain.
Infographics transform data into aesthetically pleasing pictures in 2024. The options are just as diverse as the information.
A plan outlining how you will raise your website’s search engine rating over time is known as a long-term SEO strategy. Given that SEO takes time, it’s critical to establish a long-term plan. It may take several months or even years to observe noticeable changes.
Website Visitors. Since people are more likely to share and click on primarily visual content, these lovely data-graphics help increase website traffic.
Conclusion:
Infographics are a useful tool for providing important information and improving user experience by making important details easily available. They increase content engagement and meet the needs of consumers who want to quickly read information. Search engine rankings may benefit from increased engagement with excellent infographics since it indicate the importance and validity of the shared material. In summary, employing infographics improves a website’s search engine performance and visibility in addition to helping users by simplifying difficult facts.





[…] how SEO infographics can transform your strategy in 2025 and take your digital presence to the next […]